Minimal flickering with the new and faster Google Optimize snippet
At the end of April Google launched a new implementation of Google Optimize, using a completely redesigned snippet. According to Google, the new Optimize snippet has a number of advantages in implementation, loading speed and flickering. To find out to what extent these benefits actually are valid, we compared different configurations of the new and old Optimize snippet. This resulted in the following findings:
-
- The new snippet performs better in terms of web performance (page speed)
- The effect of flickering has been considerably reduced when using the new snippet, which increases test validity
- The new snippet is easy to implement
- Loading of the new snippet is independent of Google Analytics
In this article, we will discuss our findings, the test set-up we have applied and advise on the optimal implementation of Google Optimize for your website.
The different implementation methods
We have chosen to compare the most common old snippet implementations with the new snippets. We tested the variants below, both with and without anti-flicker script:
- Old: Optimize snippet via GTM (asynchroon, frequently used)
- Old: Optimize via gtag.js (asynchroon)
- New: Optimize.js snippet (asynchroon)
- New: Optimize.js snippet (synchroon)
A total of nine identical pages were created and different configurations were tested. As previously mentioned, the difference between the old and new implementation is that there is no longer any dependence on the Google Analytics script. At the end of this article our test set-up is explained in more detail.
Old vs new snippet: What is the impact on loading speed?

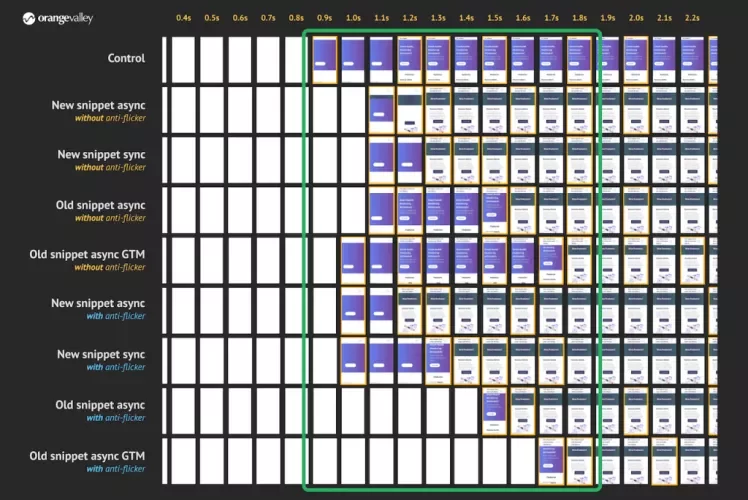
Comparison of filmstrip rendering for different Google Optimize implementations
Each screen in the filmstrip above is 100 milliseconds (ms), what you see happening visually takes 100 ms or less. The first visible difference between all implementations is that the control page appears first.
The async snippet without using the anti-flicker script is the best performing variant (fast rendering and minimal flickering). The worst performing variant is loaded asynchronously with the old snippet via Google Tag Manager. This is a common method when implementing Google Optimize.
The anti-flicker script
In addition to the various implementation methods, the use of an anti-flicker script was also examined. The effect of the anti-flicker script can be clearly observed with the async variants of the old snippet. The blank white screens hide the control page, but also slow down the perceived loading time. As long as nothing appears on the screen, the user experiences this as a longer loading time, which has consequences for the behavior of these visitors. This can lead to visitors leaving the website. If you compare the duration of these blank white screens with the views of the async variants of the old snippet without the anti-flicker script, you can see that the script does what it is intended for.
But what also becomes clear from this visual comparison is that there is always flickering, but there is a clear difference in the duration. A flickering of 100 ms or less will hardly be noticed, but taking longer will affect the validity of the test.
The anti-flicker script seems to work less effectively with the variants of the new snippet that are loaded async. Although Google recommends for async to use the snippet and sync only when certain conditions are met, the user seems better off, and the test is more reliable when the anti-flicker script is not applied within our test.
The difference in metrics

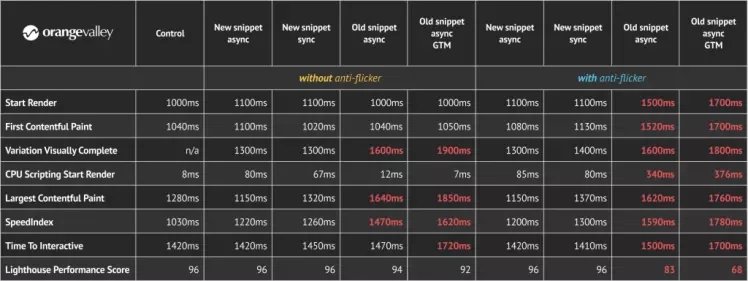
Comparison of performance metrics for different Google Optimize implementations
In the table above we see that the new snippets perform better on almost all relevant metrics. Fast loading starts with early rendering. Metrics like Start Render and First Contentful Paint provide this insight. However, based on these metrics we don’t know if there is any flickering, which is very important as it is irrelevant and undesirable that the control page be shown in the early rendering. The metric Variant Visually Complete tells us when a variant visually appears on the screen and seems fully loaded to the user.
A big difference between Variant Visually Complete and First Contentful Paint usually indicates long-term flickering. We can also visually confirm this based on the film strips (render timelines). What is striking is that configurations with the new snippet clearly perform better at this point than that of the old snippet.
Google Optimize is a client-side testing tool, which means that the processing of an experiment is performed entirely in the browser. Google Optimize does not load a server-side rendered variant from the server. Client-side processing affects page load times. Since a lot of JavaScript is involved, among other things, to manipulate the control page in the browser into a variant, processor power plays an important factor.
For example, a browser will need more time for processing on popular budget smartphones because the processor on this type of device is much slower, which increases the loading time. What is important to remember is that a client-side A/B testing tool like Google Optimize will always show some flickering in certain circumstances. The only solution to prevent this is to use a server-side tool such as SiteSpect.
Advice on the new Optimize snippet
We recommend applying one of the new implementation types of the Google Optimize snippet. This not only results in a better user experience through faster loading times, but also significantly reduces the amount of flickering which contributes to the validity of tests. When possible, the advice is to test the new and old configurations on your own website because every website is technically different. On the one hand, it is relevant to find out how much improvement this will yield, and on the other hand which new implementation type best suits the website.
Conclusion
With the introduction of the new Optimize snippet, Google has made a considerable leap in the ease of implementation on the one hand and the user experience that benefits test validity on the other. The best implementation choice depends on the technical construction of the website and to what extent to accept limited flickering. Whatever choice is made, the renewed snippet will always have a positive effect on the test process.
Are you curious about the impact of the new Google Optimize snippet on your website? OrangeValley has the knowledge and experience to support you in this process. We are ready to think along with you! Contact us for more information.
More background information on our test approach
Using a synthetic testing tool (SpeedCurve Synthetic), we measured the impact of Google Optimize on page load time. A synthetic tool offers the possibility to load the same page multiple times under the same conditions (network simulation and device emulation). It is a lab set-up that allows you to gather technical insights, compare page results and analyze how a potential user will experience the loading time.
Because every website is different, the outcome for other websites or pages may differ, but we expect to see a similar trend. If you want to know how ‘real’ users experience the page, you can use real user monitoring in a production environment. The pages we tested are not part of a popular website, so we are only able to collect lab data.
We tested the pages using a Samsung Galaxy S8 emulation (achieved through CPU throttling). Today, this device is still one of the most used smartphones on many websites. We simulated a 4G connection, the values of which correspond to a very optimal connection in the Dutch market. In practice, the bandwidth of the connection will be smaller, and the latency (network delay) will be higher.
The pages are relatively simple in design and construction (low in the number of KBs, requests and DOM nodes), but are provided with some additional third-party sources (web analytics, tag manager, scripts for advertisement post-tracking, etc.) that are used by almost every website. We have not implemented any optimization for web fonts, so it will take some time for the text to become visible in the custom web font. This is a situation that we also observe a lot in practice.
In SpeedCurve we tested every page 9 times. Then, of the nine tests, the median was used to perform the comparison. We compared the results on each relevant performance metric in SpeedCurve, a selection of which can be seen in the table above. The film strips or render timelines show the differences visually. This not only gives a good idea of the speed at which each page is displayed, but also shows whether there is flickering, its duration and how long a control page is intentionally hidden by the anti-flicker script through a blank white screen. The findings and advice we share in this article are based not only on the visual comparison but also on the measured performance metrics.
This article is written by Sander Heilbron in collaboration with; Jeroen Witteman, Mike van der Burgt & Arjan Doppenberg


